Power BI and Excel dashboards you can open and explore. Select one to view it here.
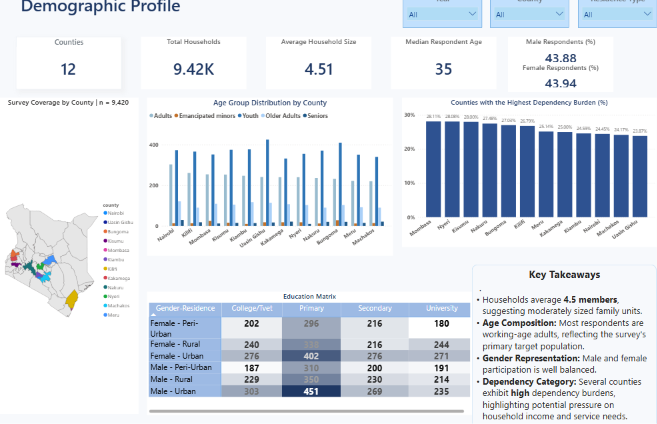
Power BI · View project
Household Survey
A six-page Power BI report on household vulnerability, with the survey, data checks and findings behind it.
Data visualisation
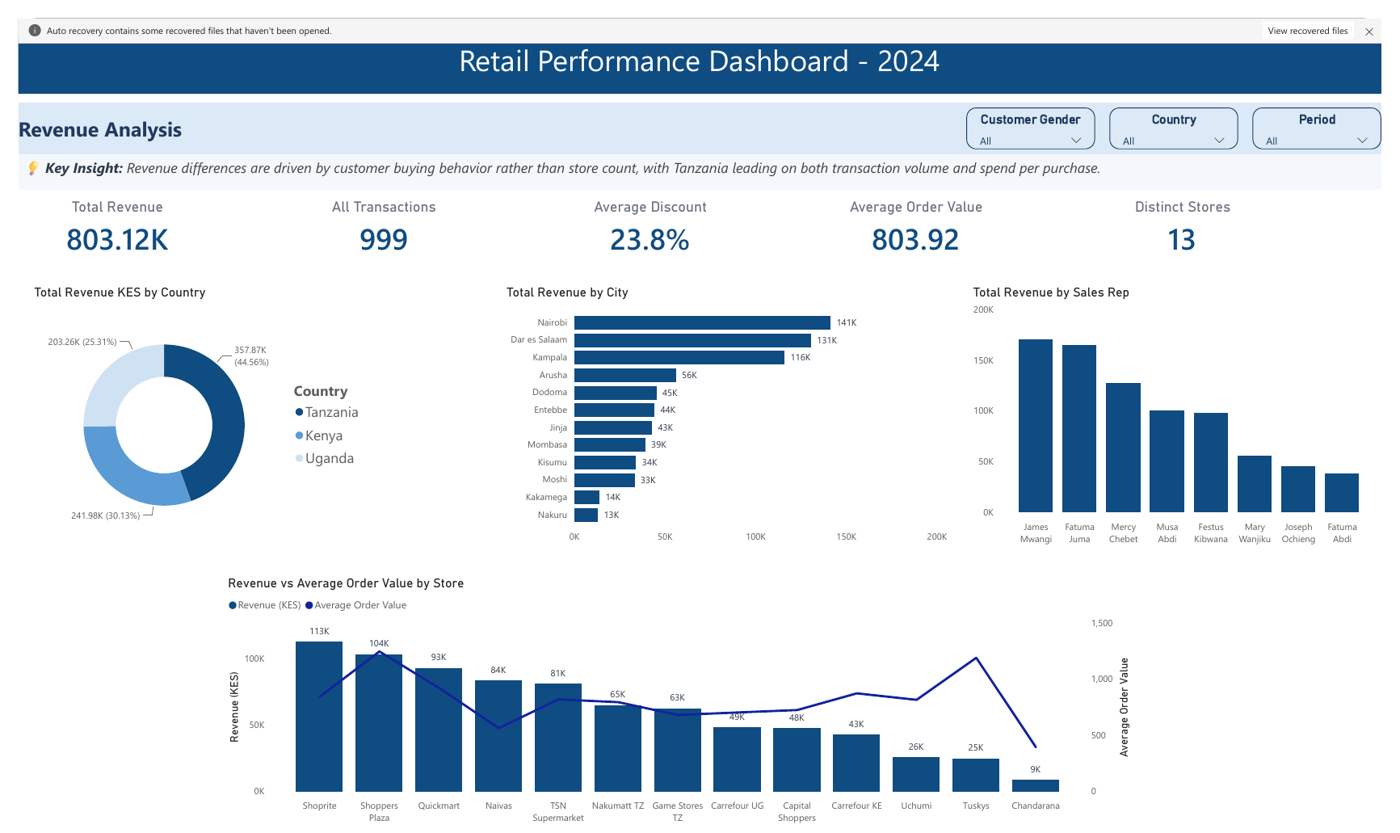
Power BI · View project
East African Retail Stores
One long report in four sections: revenue, products, seasonality and stores, with the cleaning and findings behind it.
Data visualisation
Power BI
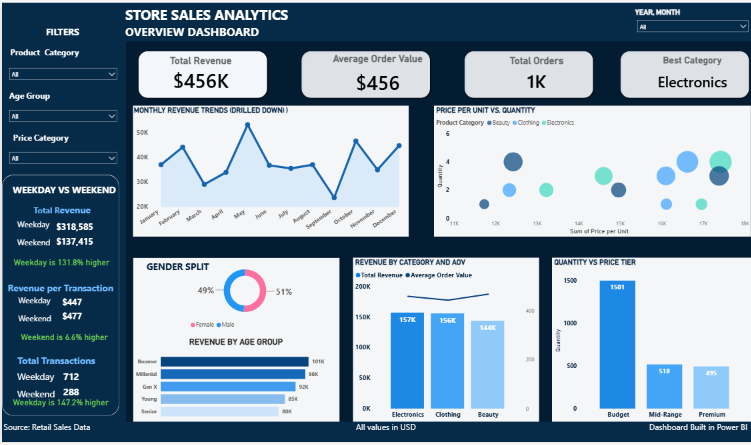
Store Sales Analytics
Revenue, order value and category mix for a small store, with weekday against weekend and age and gender splits.
Data visualisation
Power BI
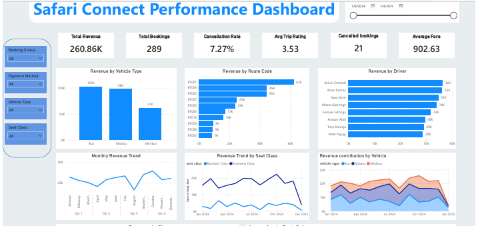
Safari Connect Transport
Revenue, bookings and cancellations for a transport company, by vehicle, route, driver and seat class.
Data visualisation
Power BI
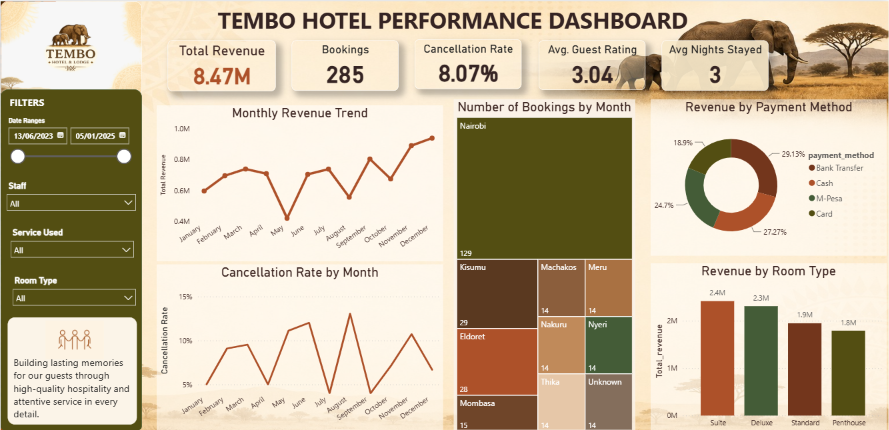
Tembo Hotel Bookings
Revenue, bookings and cancellation rate for a hotel, by month, city, payment method and room type.
Data visualisation
Excel
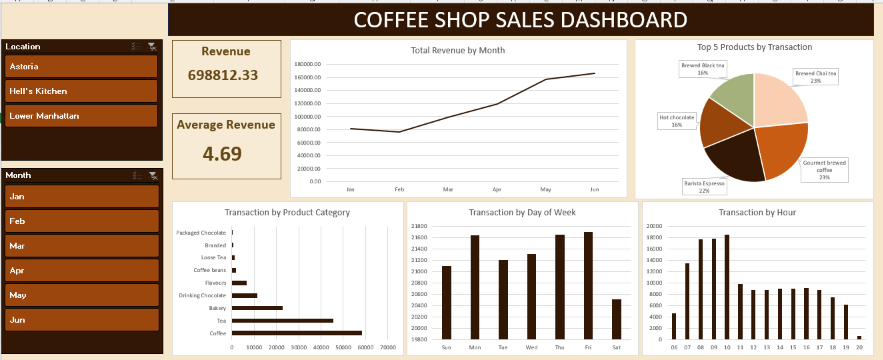
Coffee Shop Sales
Revenue by month, product, weekday and hour across three locations, with location and month slicers.
Data visualisation
Excel
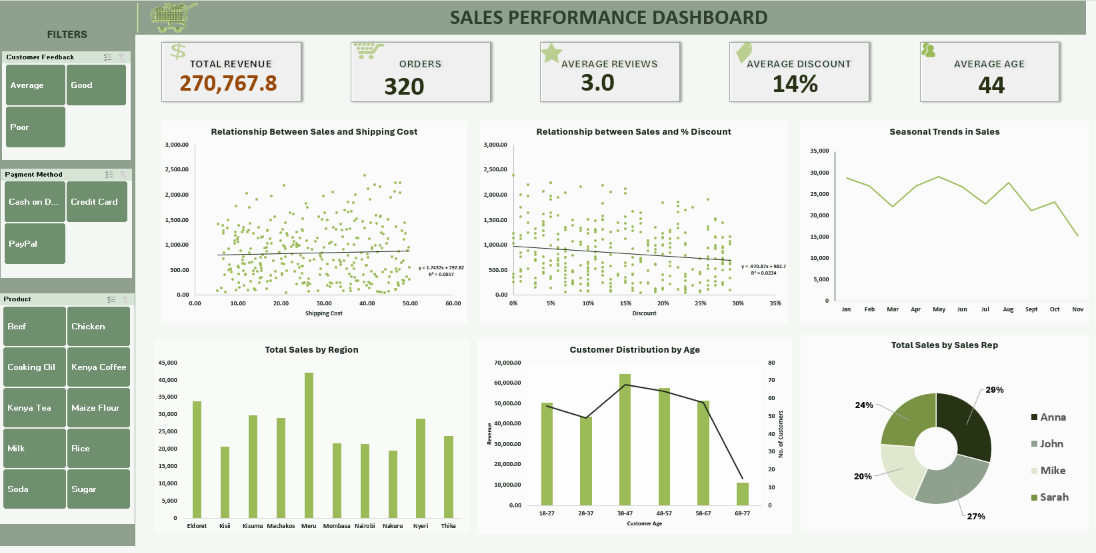
Sales Performance
Sales against shipping cost, discount, region, customer age and sales rep, with feedback, payment and product slicers.
Data visualisation